This is the grid layout that we apply to each page. The did not want to place the text on the image itself as we thought be more difficult for the kids to read the texts.
Printing process
Our initial decision was to produce a hardcover copy of the book. A hard cover version would give our book a classic feel to it, similar to the Walt Disney fairy tale books such as Beauty and the Beast or Cinderella. However, we opted for the soft cover version of the book due to time constraints. Producing a hard cover book requires at least one week while a soft cover book required at least 3 days.
Fortunately, I managed to find a printer service who could print and bind the book in 30 minutes! The shop is called Leadership Centre at Peace Center, near Doby Ghaut MRT.
The printing was done on Saturday. 2 days before the presentation date.
On the day of the printing, I was given a variety of papers to choose from. There were glossy papers, cast coated, matte, machine coated, each of which were of varying thickness and feel. At the end of it, I opted for the story to be printed on matte coated paper and the glossy coated paper for the cover page. This would help differentiate the cover page from the rest of the pages.
The book is printed on both sides, bounded by stapling at the center.
Monday, April 12, 2010
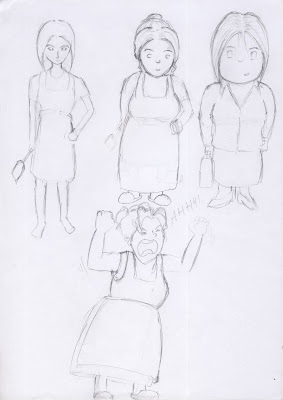
POssible characters thumbnails
Storybook storyboard
This is the storyboard sketch of the book. The story is broken up into frames. The first few frames creates the setting and addresses the problem. At the 7th frame, we introduce the 'complication' which will allow him to realize his problem later. Next we show him thinking about it and his actions to change his attitude.
Storybook design process (storyline)
Storyline
The story is about a boy who got addicted to playing games at a tender age of 7 -9 years old and how he deals with it thereafter.
The message that we wish to send across is that gaming can become an obsession if left unchecked. This is very relevant in our society today as we see kids playing their hand held game console at every place i.e. in the MRT, on the bus, in school, while walking home etc.
Infographic development
This is my initial design. The guy at the center is suppose to represent mankind. The whole purpose of this design is to show that we as humans have to choose which route to take. The consequences on the left are those of more death and disasters such as droughts, floods etc. On the other hand, we can choose to take actions by collaborating with one another to better manage resources, control existing usage or provide greater incentive to use alternative energies.
However I decided to scrap the idea altogether mainly because the presentation of this image makes it such that there are only 2 routes to take, which may not necessary be the case.
Infographic - Fighting Climate Change
Firstly, I have to say doing this infographic is really a challenge. Considering I have no colour sense, finding the right colour to use had become so much of a chore, it was very frustrating.
OK, moving on from my rants. The article i chose is authored by the United Nations Environment Programme in 2007.
In this infographic, I wanted to provide awareness on the more important indicators of climate changing. And since our target audience are the subscribers of such genres of magazines, I think it would be better if i leave out most of the technical details.
I wanted to show degree of worsening or improvement of each indicator. Hence, the use of the thermometer. The 'glow' of yellow and red indicators the importance level of the indicator.
I positioned the Earth close to the fire to tell the viewer that global warming does exist and it is a very serious matter that we should be concern about.
Lines are drawn from various positons on the Eart to lead the reader to the body of text which are placed close to them. Closer proximity between each text and its corresponding lines is ensured to indicate their relationship.
Link to report: www.unep.org/geo/geo4/media
Subscribe to:
Posts (Atom)